X
Facebook
Instagram
YouTube
Contact Us
LA Health Portal
Emergency
Search
Patient Information
Get Coverage & Care
Get Care-Health Services Patients
Hospital Price Transparency
Get Coverage – Financial Services & Billing
Appointments
Patient Relations
My Health LA
Prepare for Your Visit
Prepare for Your Outpatient Visit
Prepare for Your Video Visit
Prepare for Your Hospital Stay
Message Your Doctor or Request an Appointment
LGBTQ+
Language Access Services
Accessibility (ADA)
Patient Rights & Responsibilities
Records & Forms
Medical Record Requests
HIPAA Forms
Advanced Healthcare Directive
Notice of Privacy Practices
Utilization Management Disclosures
Care Now
Nurse Advice Line
eVisits for Online Care
Our Services
Primary Care
Adult Medicine
Family Medicine
Geriatrics
Pediatrics & Adolescent
Positive Care/HIV
Premature Infant
Women’s Health
Additional Resources
Resources
Housing
Housing for Health
Food
Transportation
Legal
Immigration
Whole Person Care
Correctional Health
Correctional Health Services
Juvenile Court Health Services (JCHS)
Office of Diversion & Re-entry (ODR)
Quality Improvement, Patient Safety and Clinical Risk Management
Trauma, Emergency & Bioterrorism Response Assessment
Specialty Care
Adult & Pediatrics Specialty Care Listing
Medical Hubs
Rehabilitation Services
Specialty Care Locations
Care Now
Nurse Advice Line
eVisits for Online Care
Diagnostic Services
Labs
Radiology
Mental Health
Substance Use
Urgent Care
Emergency Services
Pharmacy
Our Locations
Our Hospitals
Los Angeles General Medical Center
Harbor-UCLA Medical Center
Olive View – UCLA Medical Center
Rancho Los Amigos National Rehabilitation Center
Health Centers (A-E)
All Health Centers
Antelope Valley Health Center
Bell Health Center
Bellflower Health Center
Curtis R. Tucker Health Center Adult Clinic
East Los Angeles Health Center
Edward R. Roybal Comprehensive Health Center
El Monte Comprehensive Health Center
Health Centers (G-L)
Glendale Health Center
H. Claude Hudson Comprehensive Health Center
High Desert Regional Health Center
Hubert H. Humphrey Comprehensive Health Center
La Puente Health Center
Lake Los Angeles Community Clinic
Littlerock Community Clinic
Long Beach Comprehensive Health Center
Health Centers (M-Z)
Martin Luther King, Jr. Outpatient Center
Mid-Valley Comprehensive Health Center
Northeast Health Center
San Fernando Health Center
South Valley Health Center
Torrance Health Center
West Valley Health Center
Wilmington Health Center
Who We Are
Our Leadership
Mission, Vision, Values
Public & Media Relations
Pulse Newsletter
Press Release
Introducing Los Angeles General Medical Center
Monterey Park Mass Shooting
NACo Award Winners
Hospital and Health Care Delivery Commission
Work or Partner With Us
Careers
People Services
Volunteer Services
Patient Family Partnership Hub
Employee Health Services Forms
Contracting with Health Services
Partnering with Health Services
Equity, Diversity, Inclusion, and Antiracism Initiative
Education
College of Nursing & Allied Health
Office of Nursing Affairs
Emergency Medical Services (EMS) Agency
Our Reports
Overall ODR Data
Home
»
Our Services
»
Resources
»
Office of Diversion and Reentry
»
Overall ODR Data
header-title-decoration
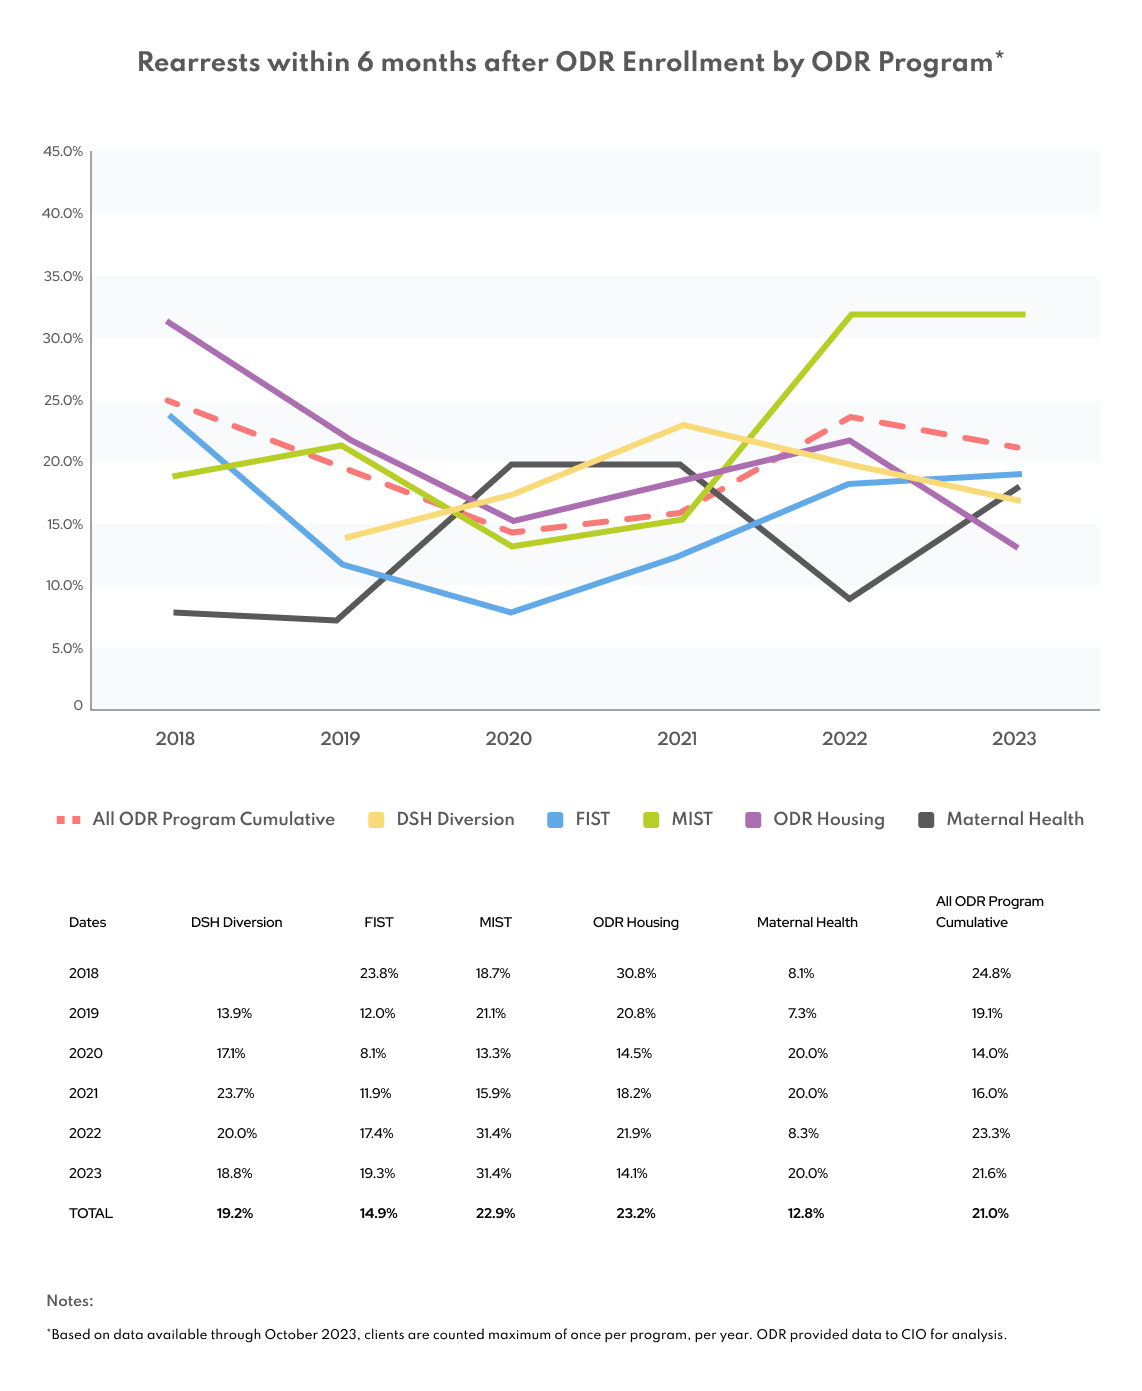
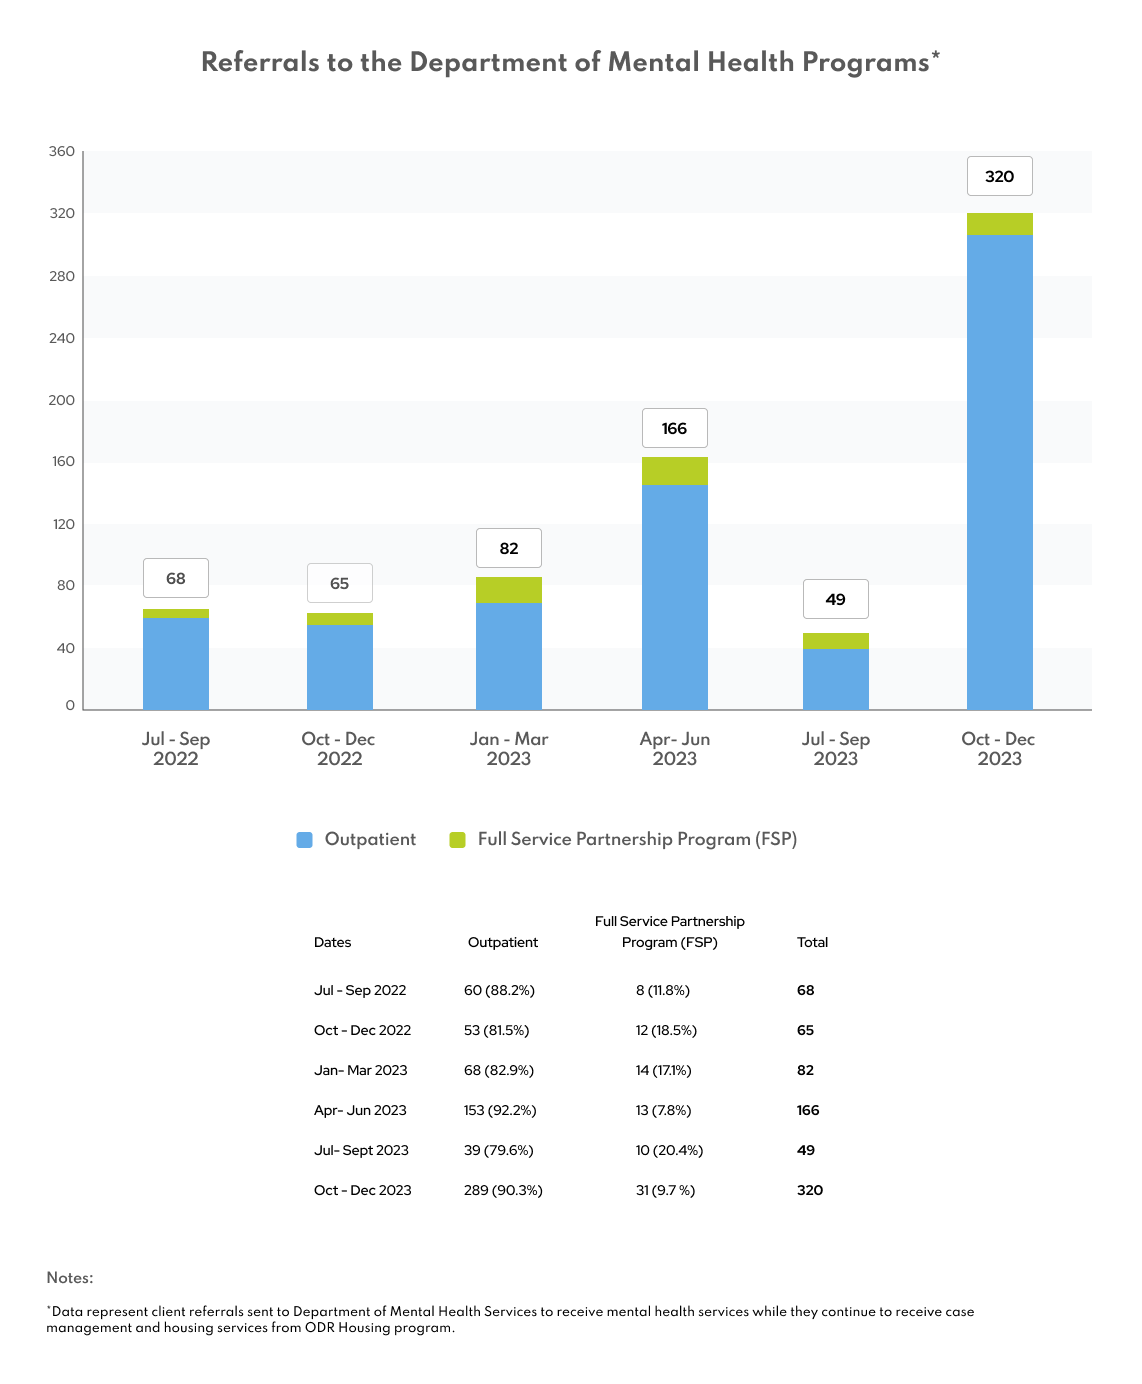
Overall ODR Data
Patient Information
Get Coverage & Care
Get Care-Health Services Patients
Hospital Price Transparency
Get Coverage – Financial Services & Billing
Appointments
Patient Relations
My Health LA
Prepare for Your Visit
Prepare for Your Outpatient Visit
Prepare for Your Video Visit
Prepare for Your Hospital Stay
Message Your Doctor or Request an Appointment
LGBTQ+
Language Access Services
Accessibility (ADA)
Patient Rights & Responsibilities
Records & Forms
Medical Record Requests
HIPAA Forms
Advanced Healthcare Directive
Notice of Privacy Practices
Utilization Management Disclosures
Care Now
Nurse Advice Line
eVisits for Online Care
Our Services
Primary Care
Adult Medicine
Family Medicine
Geriatrics
Pediatrics & Adolescent
Positive Care/HIV
Premature Infant
Women’s Health
Additional Resources
Resources
Housing
Housing for Health
Food
Transportation
Legal
Immigration
Whole Person Care
Correctional Health
Correctional Health Services
Juvenile Court Health Services (JCHS)
Office of Diversion & Re-entry (ODR)
Quality Improvement, Patient Safety and Clinical Risk Management
Trauma, Emergency & Bioterrorism Response Assessment
Specialty Care
Adult & Pediatrics Specialty Care Listing
Medical Hubs
Rehabilitation Services
Specialty Care Locations
Care Now
Nurse Advice Line
eVisits for Online Care
Diagnostic Services
Labs
Radiology
Mental Health
Substance Use
Urgent Care
Emergency Services
Pharmacy
Our Locations
Our Hospitals
Los Angeles General Medical Center
Harbor-UCLA Medical Center
Olive View – UCLA Medical Center
Rancho Los Amigos National Rehabilitation Center
Health Centers (A-E)
All Health Centers
Antelope Valley Health Center
Bell Health Center
Bellflower Health Center
Curtis R. Tucker Health Center Adult Clinic
East Los Angeles Health Center
Edward R. Roybal Comprehensive Health Center
El Monte Comprehensive Health Center
Health Centers (G-L)
Glendale Health Center
H. Claude Hudson Comprehensive Health Center
High Desert Regional Health Center
Hubert H. Humphrey Comprehensive Health Center
La Puente Health Center
Lake Los Angeles Community Clinic
Littlerock Community Clinic
Long Beach Comprehensive Health Center
Health Centers (M-Z)
Martin Luther King, Jr. Outpatient Center
Mid-Valley Comprehensive Health Center
Northeast Health Center
San Fernando Health Center
South Valley Health Center
Torrance Health Center
West Valley Health Center
Wilmington Health Center
Who We Are
Our Leadership
Mission, Vision, Values
Public & Media Relations
Pulse Newsletter
Press Release
Introducing Los Angeles General Medical Center
Monterey Park Mass Shooting
NACo Award Winners
Hospital and Health Care Delivery Commission
Work or Partner With Us
Careers
People Services
Volunteer Services
Patient Family Partnership Hub
Employee Health Services Forms
Contracting with Health Services
Partnering with Health Services
Equity, Diversity, Inclusion, and Antiracism Initiative
Education
College of Nursing & Allied Health
Office of Nursing Affairs
Emergency Medical Services (EMS) Agency
Our Reports
X
Facebook
Instagram
YouTube
Contact Us
LA Health Portal
Emergency
48239